Initial snapshot baseline
- Average precision
- 0.056054
- ROC AUC
- 0.686141
- Brier score
- 0.033814
- Events among top 505
- 36
TRODEON · Research
History-informed features improved repair-event ranking over our initial snapshot baseline in independent offline experiments. A separate calibration experiment improved probability scoring. These results describe research on a public historical maintenance dataset—not validation of the Trodeon application or a customer fleet.
Independent offline research performed in Arena. Reused-test development evidence—not fresh blind confirmation, named-fault diagnosis or operational readiness.
01 / Measurement
Source: SCANIA Component X, Version 3. The research target was recorded repair/replacement within 48 anonymized dataset time units. Those units are not real days, and the recorded event is not confirmed physical root cause or proof of successful repair. This binary research target differs from the official five-class challenge task.
All three comparisons below use the same reused published test cohort: 5,045 vehicles and 142 labelled events. The ranking comparison selects 505 records in each method; it is not a recommended operating workload.
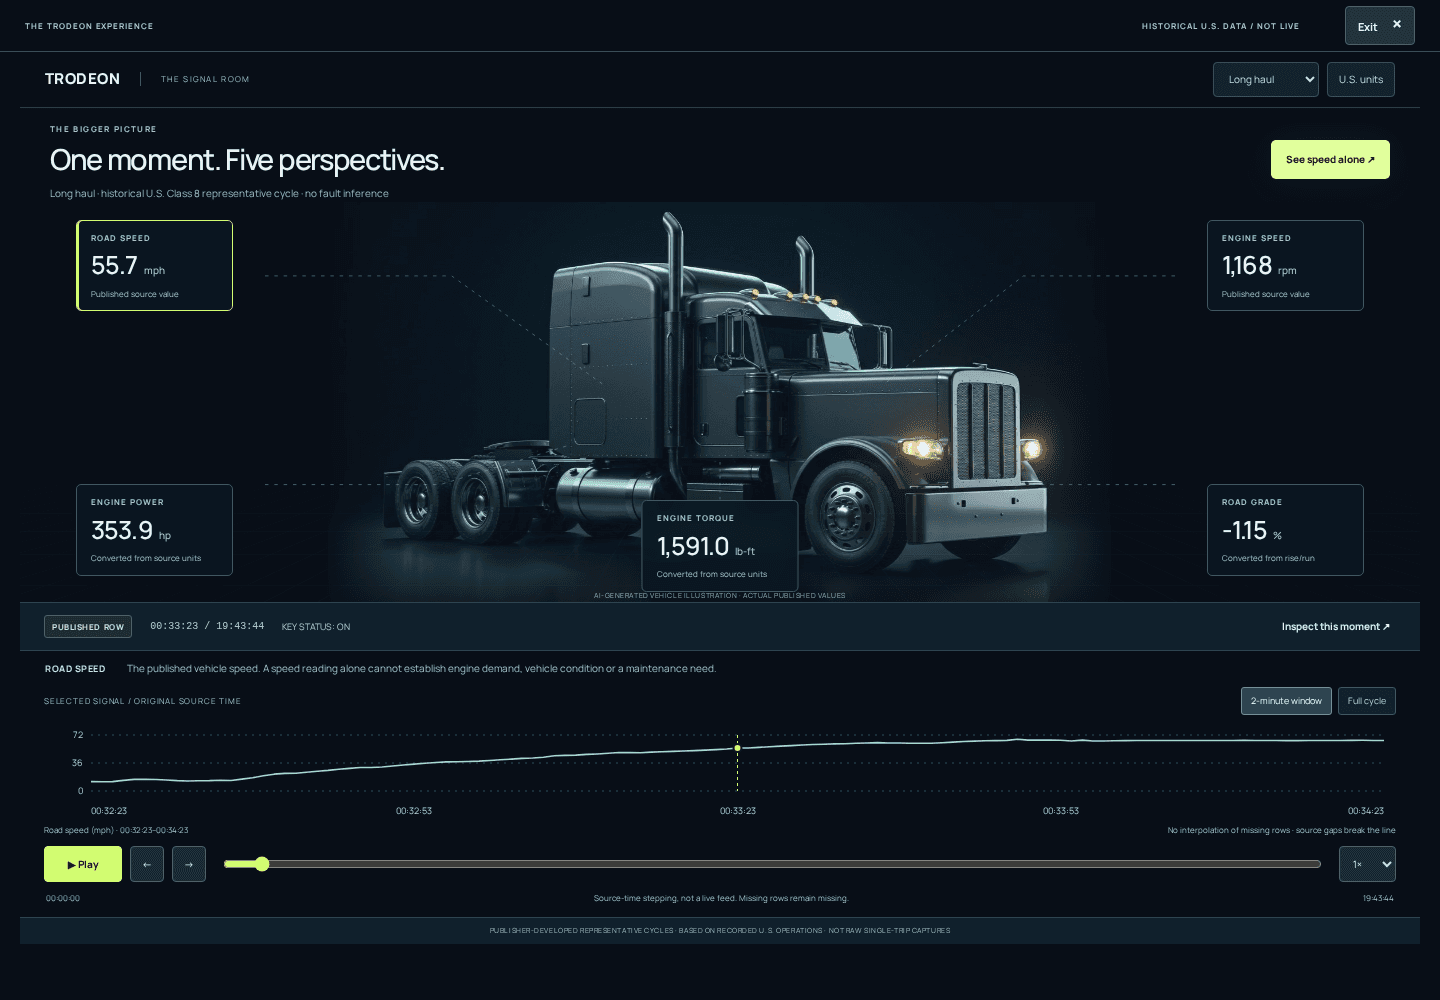
Offline / historical test-data example
This supplied Signal Room display uses historical U.S. published-source values. It is not live vehicle data and does not verify live Trodeon operation.
02 / Same-cohort results
| Method | Average precision | ROC AUC | Brier score | Events among top 505 |
|---|---|---|---|---|
| Initial snapshot baseline | 0.056054 | 0.686141 | 0.033814 | 36 |
| History-informed features | 0.099497 | 0.740999 | 0.029734 | 49 |
| History plus calibration | 0.099497 | 0.740999 | 0.026671 | 49 |
Higher average precision and ROC AUC indicate better ranking; lower Brier score indicates better probability scoring. AUC is not accuracy.
History features captured 13 additional labelled events within the same 505-record ranking budget compared with the snapshot baseline. That does not establish avoided breakdowns, correct repairs or customer savings.
The calibration map preserved ranking, so average precision, ROC AUC and the top-505 event count did not change. The training-prevalence constant had a test Brier score of 0.027355: uncalibrated history scores were worse than this constant, while calibrated history scores were better.
03 / Method
The offline research retained the publisher’s training, validation and test vehicle splits and checked them for overlap. Eleven publisher files were checked against published sizes and SHA-256 values. Model preprocessing was fitted on training data only.
The initial snapshot model used histogram gradient boosting. The history experiment retained the learner and weighting approach while adding 241 past-only history features. Future and same-time readouts were excluded from prior history. The initial baseline predictions and metrics were reproduced before the history comparison.
Calibration used a positive-slope sigmoid applied to fixed history-model scores. Of 5,046 development vehicles, 2,523 were assigned to calibration fitting and 2,523 to threshold selection using label-independent assignment. The calibration map was not fitted on test outcomes.
These are summaries of the Arena research methods, not claims that Polsia independently reproduced the experiments.
04 / Limitations
05 / Attribution
Dataset: SCANIA Component X, Version 3.
DOI: https://doi.org/10.5878/bnh5-ka77
Official catalogue: https://researchdata.se/en/catalogue/dataset/2024-34/3
License: Creative Commons Attribution 4.0.
License link: https://creativecommons.org/licenses/by/4.0/
Dataset creators credited by the publisher: Tony Lindgren, Olof Steinert, Oskar Andersson Reyna, Zahra Kharazian and Sindri Magnússon.
Trodeon’s offline research transformed the source data into features and a binary repair-event target for the comparisons described here. These analyses are separate from the source publication. Source attribution does not imply a partnership, customer relationship or endorsement.
06 / Before additional signal work
Review and document each item for the exact source and use being considered. No new source, account, fleet, vehicle, device, field set, time window, cadence, retention period, driver-linked scope, or additional use is identified or confirmed here; those details must remain unconfirmed until they are supplied and reviewed.
Identify the vehicle and engine type, and the specific target fleet or vehicle population. Record any limits on which vehicles or operating contexts are included.
Identify the source or provider and product or API version. Review its authoritative documentation and schema, field meanings, units, and time semantics. Document where the data came from, the applicable rights, and who has authority to grant access.
Specify the account, fleet, vehicles, and devices; each field; the historical window; collection cadence; retention period; and whether any driver-linked data is included. Leave every unspecified value unconfirmed.
State each intended use and explicitly list excluded uses. Do not infer permission for a different purpose, secondary use, or operational action from the existence of a source or access to its data.
The owner must explicitly approve the identified source, defined data scope, and permitted use before any additional source, scope expansion, ingestion, or integration work proceeds. Reviewing or completing this checklist is not approval. Approval for one source, scope, or use does not cover a different source, scope, or use.
This public page is informational only: it has no approval control and does not record or imply owner approval. The offline dataset attribution above applies only to the research described on this page; it does not approve another source or use.
Publication scope
This page presents aggregate results and a methods summary only. It contains no vehicle-level records, identifiers or predictions and is not a complete executable reproduction package.
Back to the TRODEON homepage